To access the Health scale that ranks connection quality from best to worst, follow these steps:
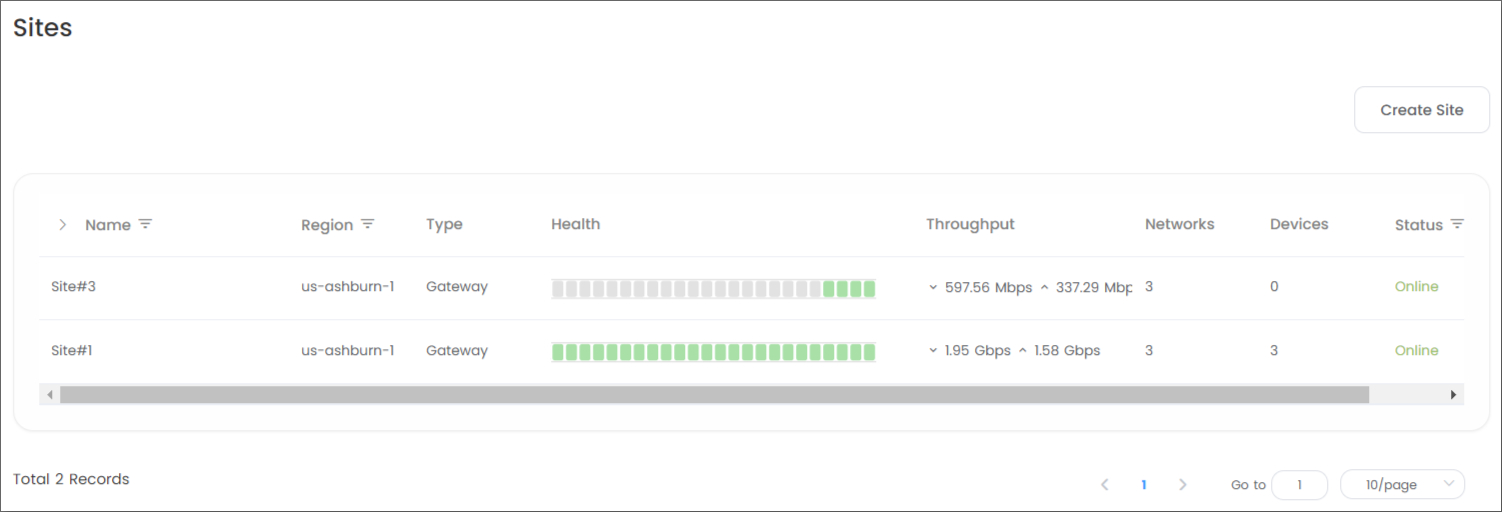
- Go to Timus Manager > Sites page.
- Locate the site from the list on the page.
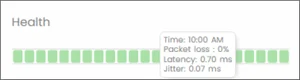
- The past 24 hours are color-coded in green, yellow, red, and gray (null) on the scale for easy identification under the Health section.
- When you hover your mouse over the scale, you will be able to see a pop-up information box showing the measurement values within that hour.
- For a more detailed overview of the connection health, click on the ellipsis icon located on the site row and select "View" from the dropdown menu.
- This will provide you with comprehensive information on the status of your connection.
- The overall values for Latency, Jitter, and Loss are presented to the right of the scale.
Updated
Comments
0 comments
Please sign in to leave a comment.